I placed my first anytime touchdown scorer bet in 2014, picking a backup running back because his name sounded lucky. He got three carries all game and never sniffed the end zone. That afternoon cost me a tenner and taught me something worth far more – gut feelings are expensive in prop markets. Twelve years later, the anytime touchdown scorer market has become the single most popular player prop by betting volume, and the gap between punters who treat it as a lucky dip and those who approach it with a repeatable framework keeps widening.
This guide is the framework I use every week during the NFL season. It is not a list of picks – those expire by Sunday. Instead, it is a system for identifying value in the ATTS market, built on the metrics and processes that have consistently separated profitable bettors from the rest. If you are new to touchdown props altogether, the anytime scorer strategy only makes sense once you understand the basics, so I would suggest starting with the fundamentals before diving into process. For everyone else, let’s get into the method.
To maximize your edge, it is crucial to understand how red zone data predicts touchdowns before placing your wagers.
Scoring Dynamics: Core Structural Mechanics of Player Props
A mate of mine once spent an entire Thursday night studying wide receiver route trees. He could tell you the difference between a dig and a sail concept, but he had no idea that 73.9% of all NFL touchdowns are scored inside the red zone. That number is the single most important fact in this entire market. It tells you that touchdowns are not random acts of brilliance scattered across the field – they are concentrated events that happen in a very specific 20-yard corridor, and 86.6% of rushing touchdowns come from inside that same area.
Understanding this concentration changes how you evaluate players. The wide receiver who racks up 120 yards on deep crossers but rarely enters the red zone is a fantasy football darling, not an ATTS candidate. Meanwhile, the slot receiver who averages 45 yards per game but runs six red zone routes per week is far more interesting for touchdown scorer purposes. Volume inside the 20 matters more than total yardage, more than highlight catches, more than any narrative the TV broadcast builds around a player.
Three forces drive touchdown scoring at the NFL level. The first is offensive philosophy – some teams run the ball at the goal line almost exclusively, while others spread the field and throw fades. The second is personnel usage – a team might have three capable receivers but only one who lines up in tight formations near the end zone. The third is game context, which I will cover in its own section later. For now, the core principle is simple: touchdowns are a red zone product, and your entire analytical process should start and end with what happens inside those 20 yards.
This is not an abstract observation. When I began filtering my ATTS picks through red zone data rather than overall statistics, my hit rate improved meaningfully within two seasons. The players who score touchdowns week after week are not necessarily the most talented athletes on the field. They are the ones whose coaches trust them in compressed spaces where every play is magnified. Your job is to identify those players before the market fully prices them in.
Building a Player Profile: The Five-Factor Checklist
Last season I watched a punter on a betting forum agonise for thirty minutes over whether to back a receiver who had scored four touchdowns in five games. “He’s due for regression,” the forum said. The receiver scored again that Sunday. Regression is real, but it does not override process – and process starts with building a proper player profile before you ever look at the odds.
I evaluate every ATTS candidate through five factors, and I refuse to place a bet until I have checked all five. Think of them as filters in a funnel: a player needs to pass each one, and the more convincingly he passes, the stronger the selection.
Factor 1: Red zone opportunity share. This is the percentage of a team’s red zone plays that involve a specific player, whether as a rusher or a target. A running back who touches the ball on 40% of his team’s red zone snaps is in a fundamentally different position from one who only sees 15%. I want to see at least 25% share for running backs and at least 15% for receivers before I consider them seriously. Remember, 23.1% of all NFL touchdowns are scored from the 1- or 2-yard line, so goal-line role matters enormously – a player who gets substituted out at the goal line fails this filter immediately.
Factor 2: Snap count and usage trend. A player’s snap percentage tells you whether his role is stable or fragile. A receiver playing 90% of offensive snaps has a much longer leash than one rotating at 55%. I also track the three-week trend – is his usage increasing, stable, or declining? Increasing usage is the best leading indicator I have found for upcoming touchdown production.
Factor 3: Target quality near the end zone. Not all red zone targets are equal. A receiver who catches short crossers at the 15-yard line faces a longer path to the end zone than one who runs corner routes and fades from inside the 10. I look at where a player’s targets are concentrated – specifically, how many of his red zone looks come from inside the 10-yard line. This data is freely available through charting services and separates true end zone threats from red zone bystanders.
Factor 4: Defensive matchup. The opponent’s red zone defence is just as important as the player’s own profile. A top-tier ATTS candidate facing the league’s best red zone defence might be a worse bet than a middling candidate facing a defence that allows touchdowns on 65% of red zone possessions. I will walk through how to read defensive matchups properly in a later section, but at the profiling stage, I at least want to flag whether the matchup is favourable, neutral, or hostile.
Factor 5: Recent scoring pattern. This is the most misused factor in the entire checklist. Punters either chase hot streaks or fade them – both are lazy. What I actually look for is whether a player’s recent scoring is supported by the first four factors. A player who has scored three touchdowns in four weeks and has strong red zone share, rising snaps, quality targets, and a soft matchup is not “due for regression.” He is a well-supported pick. A player who scored three fluky touchdowns on broken plays while averaging two red zone looks per game is the one to fade.
Target Share, Snap Count, and Red Zone Volume
These three metrics deserve their own discussion because they form the quantitative backbone of every ATTS pick I make. Without them, you are guessing. With them, you are making informed probabilistic assessments – and that is the entire difference between gambling and betting.
Target share measures how often a player is looked at as a receiver relative to his teammates. In the red zone, target share becomes even more revealing. A receiver with a 30% red zone target share on a team that enters the red zone four times per game gets roughly 1.2 red zone targets per week. That sounds modest until you realise that the conversion rate on red zone targets is dramatically higher than targets elsewhere on the field. A player who catches one of those targets inside the five has a realistic shot at scoring every single week.
I track target share over rolling four-week windows rather than season-long averages. Season-long data gets diluted by early-season noise, coaching changes, and injury absences. A four-week window captures the current offensive identity without being so short that a single outlier game distorts the picture.
Snap count percentage is simpler but equally important. I have a hard floor of 60% offensive snaps for receivers and 40% for running backs in committee backfields. Below those thresholds, a player’s touchdown upside is too dependent on specific play calls rather than sustained involvement. The exception is true goal-line specialists – backs who play only 30% of snaps but are on the field for 70% of plays inside the five. Those players can still be strong ATTS picks despite low overall snap counts, precisely because their limited snaps are concentrated where scoring happens.
Red zone volume ties the first two metrics together. I define this as the number of times per game a player either carries the ball or is targeted inside the opponent’s 20-yard line. My threshold for serious ATTS consideration is three red zone touches per game for running backs and two for receivers. Players consistently hitting those numbers are mechanically involved in scoring opportunities, and mechanical involvement is far more predictive than talent alone.
When all three metrics align – high target share, stable snap count, strong red zone volume – you have a player whose touchdown probability is structurally supported. The market often misprices these players because casual bettors fixate on recent results rather than underlying process. That gap between process and perception is where value lives.
How Game Script Shapes Touchdown Opportunities
Here is a scenario I see play out almost every week: a punter backs a running back for ATTS, the running back’s team falls behind by 14 points in the first half, and the offence abandons the run entirely. The running back finishes with eight carries for 30 yards and zero touchdowns. The punter calls it bad luck. It was not bad luck. It was a predictable consequence of game script.
Game script – the flow of a game based on the score, time remaining, and situational context – dictates how teams allocate their offensive resources. A team trailing by two scores in the second half will throw the ball on 65% to 70% of plays, funnelling opportunities away from running backs and towards receivers. A team leading by two scores will do the opposite, running the ball to consume clock and protect the lead. This reallocation is not subtle; it transforms which players are viable ATTS candidates within a single game.
The Los Angeles Rams led the NFL in Red Zone Plus/Minus at +141 during the 2025 regular season, partly because their game scripts consistently kept them in positive territory. When a team controls the game, it controls the clock, which means more possessions, more red zone trips, and more touchdown opportunities for its featured skill players. Backing ATTS candidates on teams projected to lead is not a guarantee, but it tilts the structural odds in your favour.
I build game script projections using two inputs: the point spread and the projected game total. A team favoured by 7 points in a game with a total of 48 is expected to score around 27.5 points, which translates to roughly four touchdowns. Compare that to a team that is a 3-point underdog in a game totalling 41 – expected to score about 19 points, or closer to two touchdowns. The difference between four expected touchdowns and two is massive when you are choosing which players to back.
Practically, this means I lean towards running backs on teams projected to lead and receivers on teams projected to trail or play in high-total shootouts. It also means I avoid running backs on heavy underdogs almost entirely, regardless of how talented they are. A world-class back who never sees the red zone because his team is chasing the game all afternoon has the same touchdown probability as a backup – which is to say, very little.
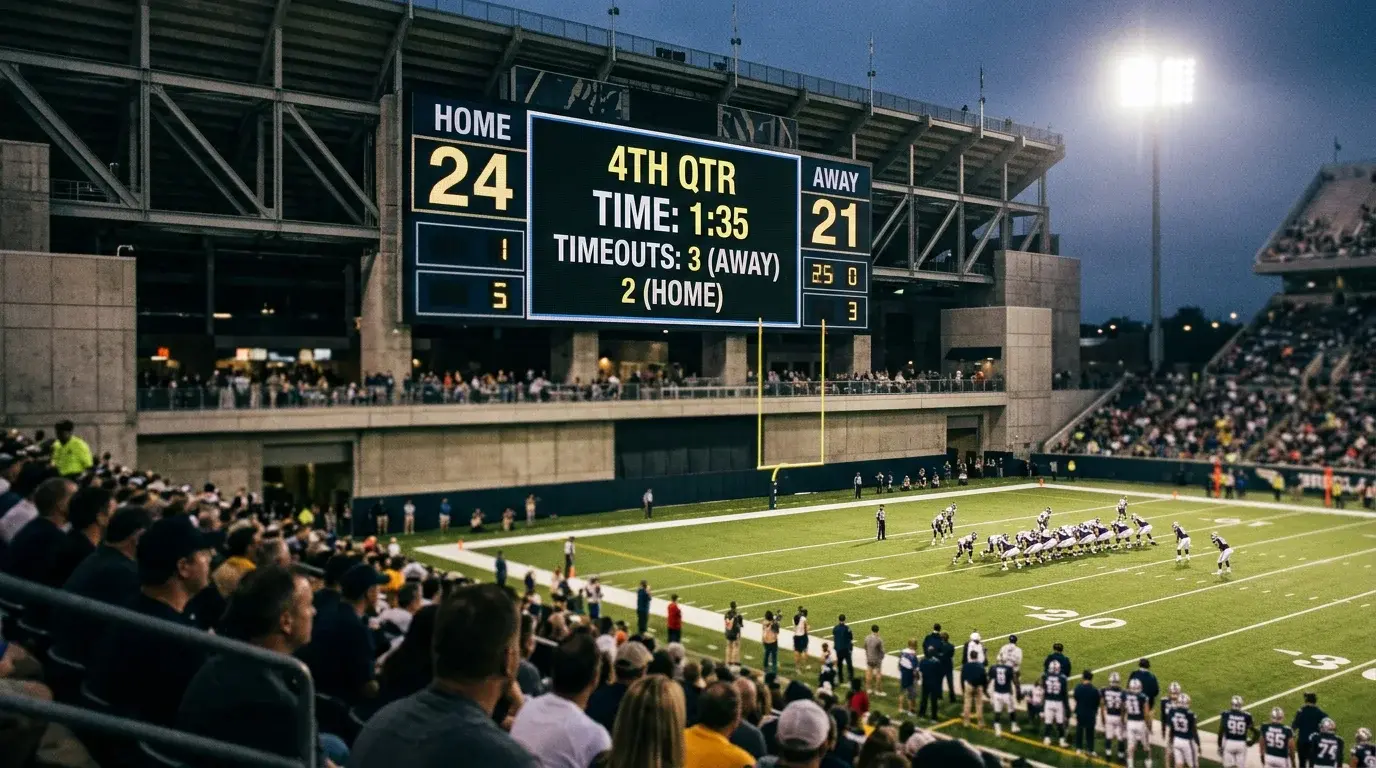
One more nuance worth noting: late-game script also matters. When a team is protecting a lead in the fourth quarter, it often turns to a specific “closer” running back who handles short-yardage and clock-killing duties. These players sometimes score garbage-time touchdowns that the market never anticipated. I keep a list of these late-game backs as secondary ATTS plays – they are not my primary picks, but at the right price, they offer genuine value.
Closing Line Value: Measuring Your Edge Over Time
Winning and losing individual bets tells you almost nothing about whether your process is sound. I learned this the hard way after a 12-week stretch where I hit 58% of my ATTS picks but still lost money because I was consistently taking worse odds than the market’s closing price. That experience introduced me to closing line value, and it changed how I measure my own performance entirely.
Closing line value – CLV – compares the odds you locked in when you placed your bet to the odds available at kickoff. If you consistently get better prices than the closing line, it means your analysis is identifying information or insight that the broader market only recognises later. As the analysts at Russell Street Report put it, consistently beating the closing line implies that your analysis contains insight the broader market eventually priced in. That is the most reliable signal of genuine edge in any betting market, including ATTS props.
I track CLV on every single ATTS bet I place, and I consider it more important than my short-term win rate. A bettor who hits 45% of ATTS picks at +EV prices will outperform a bettor who hits 55% at -EV prices over a full season. The maths is unforgiving on this point, and no amount of feel-good wins can override it.
If you want to go deeper on how CLV works in practice – how to calculate it, how to track it in a spreadsheet, and how to distinguish real edge from variance – I have written a dedicated guide to closing line value for touchdown props that covers the full methodology.
A Weekly Workflow for Selecting ATTS Picks
Every Tuesday morning during the NFL season, I open the same spreadsheet, run the same queries, and follow the same sequence. The routine is deliberate – it removes emotion and forces me to evaluate players through the framework rather than through whatever narrative the Monday night pundits were selling. Here is the workflow, step by step.
Tuesday: Build the longlist. I start by identifying every player who meets my minimum thresholds from the five-factor checklist: 25%+ red zone share for backs, 15%+ for receivers, adequate snap counts, and at least two to three red zone touches per game. This typically produces a list of 20 to 30 players across the entire slate. I do not look at odds at this stage – the goal is to identify structurally supported candidates regardless of price.
Wednesday: Layer in matchups. Once the injury reports start filtering in on Wednesday, I overlay defensive data onto my longlist. For each candidate, I check the opponent’s red zone touchdown conversion rate allowed, their defensive EPA in the red zone, and any notable personnel absences on the defensive side. A strong ATTS candidate facing a bottom-five red zone defence moves up the list. The same candidate facing a top-five defence either drops or gets removed entirely. This step usually cuts my list to 12 to 18 players.
Thursday: Check game script projections. By Thursday, the point spreads and totals have settled enough to be reliable. I map my remaining candidates to their projected game scripts. Running backs on teams favoured by a touchdown or more get a boost. Receivers in games with totals above 48 get a boost. Candidates on heavy underdogs get flagged for removal unless their individual profiles are exceptionally strong.
Friday to Saturday: Price the picks. Now – and only now – do I look at odds. I compare each remaining candidate’s price across multiple bookmakers. For each player, I estimate a “fair” probability based on his profile, matchup, and game script, then convert that probability to a decimal odds figure. If the best available odds exceed my fair price by at least 10%, I have a potential bet. If the odds are at or below my fair price, I pass. This step eliminates half of my remaining candidates on most weeks, leaving me with four to eight actionable picks.
Sunday morning: Final injury check. Between the Saturday evening inactives announcements and the Sunday morning reports, I do a final sweep. Any late scratches – a starting running back downgraded to out, a key defensive lineman cleared to play – can shift my projections enough to add or remove a pick. I lock in my final selections no later than 90 minutes before kickoff.
This process takes roughly three to four hours spread across the week. It is not glamorous, and there are plenty of Sundays where I end up with only two or three bets because nothing meets my criteria. That discipline is the point. The weeks where I force picks to fill a quota are invariably the weeks where I lose money.
For a comprehensive overview of the market, check out our expert NFL touchdown betting guide to refine your weekly approach.
Common Mistakes in Anytime TD Scorer Betting
I have made every mistake on this list at least once, and several of them more times than I care to admit. First TD prop bets require finding the right balance of opportunity, matchup potential, and price – and as BetIQ’s analysts note, managing expectations is key because extended cold streaks are a real possibility when dealing with longer odds. The same principle applies to ATTS picks, even though the odds are shorter.
Chasing last week’s hero. The player who scored two touchdowns last Sunday will have shorter odds this week, often dramatically so. The market moves fast on recent performers, and by the time you see the price, the value has usually evaporated. I fell into this trap repeatedly during my first two years – backing the same players week after week because they “kept scoring.” When they stopped, I was holding inflated prices with no structural reason to expect the touchdowns to continue.
Ignoring the goal-line vulture. Every team has at least one player who barely registers in standard statistics but gets the ball on first-and-goal from the two. These players – typically a third running back or a fullback – are invisible in fantasy football but extremely relevant in ATTS markets. Ignoring them because they are not household names is a consistent source of missed value. I have a dedicated column in my tracking spreadsheet for goal-line specialists, and they produce some of my best returns per unit staked.
Treating every week the same. Week 1 ATTS picks should look nothing like Week 14 picks. Early in the season, you are working with stale data from the previous year and limited current-season information. By midseason, you have eight-plus weeks of fresh data on snap counts, target shares, and red zone usage. My confidence in the framework scales with the amount of current-season data available, and I size my stakes accordingly – smaller early, larger once the data stabilises.
Betting every game. Not every game produces a good ATTS opportunity. Low-total games with elite defences on both sides might have only three or four total touchdowns, and the concentration of scoring among specific players becomes harder to predict. I am comfortable sitting out three or four games per slate if none of them offer picks that meet my thresholds. The urge to bet every game is the most expensive habit in prop betting.
Neglecting bankroll discipline. Touchdown props have inherent variance – even the best ATTS candidates score on only 40% to 50% of their games. A string of six or seven losses is not unusual even with a sound process. Without disciplined staking, a bad run can wipe out weeks of profit. I allocate 1% to 2% of my prop bankroll per ATTS pick and never deviate, regardless of how confident I feel about a particular selection.